Accuracy Tuning Tool Guide
Due to the error in the floating point to fixed point process, you will inevitably encounter the problem of quantization model accuracy dropout when using quantization training tools.
Typically, there are several reasons for this:
-
The original floating-point model is not favorable for quantization, such as the existence of shared ops or shared structures.
-
The QAT network structure or configuration is abnormal, such as there is a pattern without fuse in the model, and the output is not set with high accuracy.
-
Some operators are sensitive to quantization, and the quantization error of the operator accumulates layer by layer in the forward propagation process, which ultimately leads to a large error in the model output.
For the above cases, we provides the accuracy tuning tool to help you quickly locate and solve the accuracy problems, which mainly includes the following:
-
Model Structure Checking: check if there are shared ops, patterns without fuse, or quantization configurations in the model that do not meet expectations.
-
Use the QuantAnalysis Class to compare and analyze the two models automatically: by comparing, locate the abnormal operators or quantization-sensitive ops in the quantized model.
-
Use the ModelProfiler Class and the HbirModelProfiler Class to get information about the numerical characteristics of each op in the model: the obtained information includes the maximum and minimum values of inputs and outputs, etc.
The functionality of these two classes is identical, the difference is that HbirModelProfiler accepts as input only the qat hbir model. Usually you don't need to call this module manually, you can get the numerical information of both models directly from QuantAnalysis.run.
Quickstart
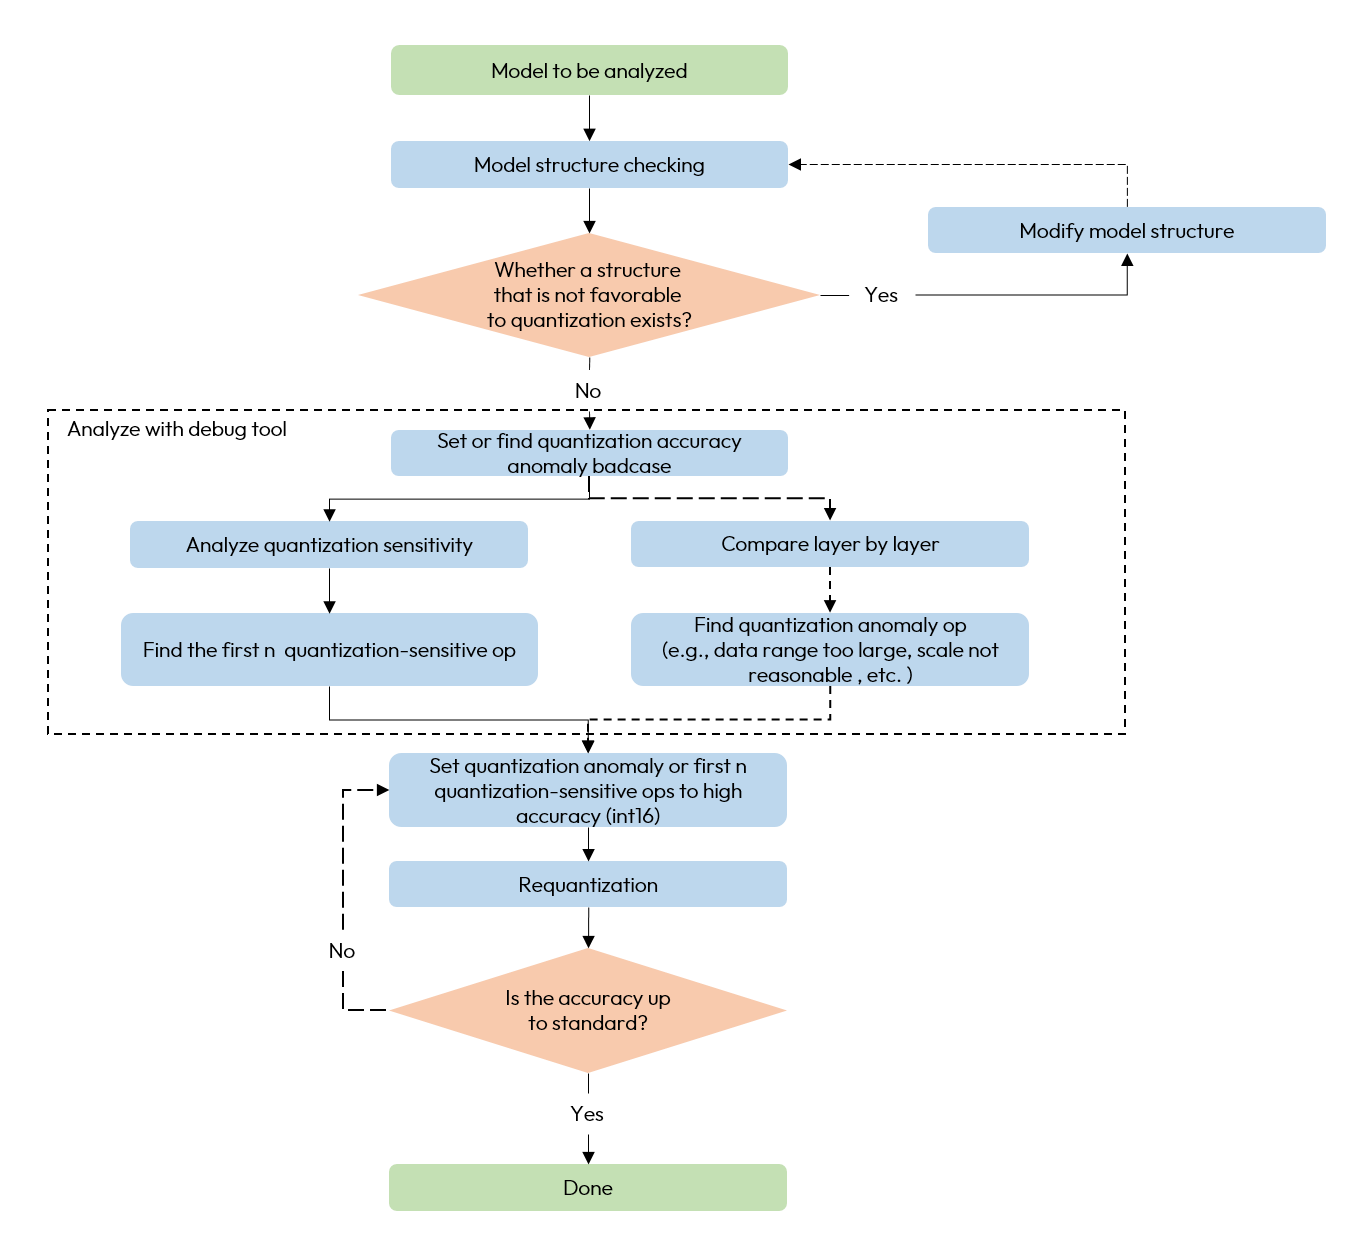
When encountering quantization model accuracy dropout problems, we recommend using the accuracy tuning tool according to the following process.
-
Check if there are any unfavorable structures or abnormal configurations in the model.
-
Use QuantAnalysis module to analyze the model as follows:
1). Find the input (i.e., the bad case) that exhibits the maximum discrepancy between the outputs of a baseline model and the model under analysis, and use this input as the input for the model.
2). Perform quantization sensitivity analysis, the current experience is that the first n L1 sensitivities are usually the quantitative sensitivity ops (the value of n varies from model to model, so there is no automatic method to determine it, so we need to try it manually, e.g., the first 10, 20...). Set the quantization sensitive op to high accuracy quantization (e.g., int16 quantization), and redo the quantization process.
3). Or compare the inputs and outputs of the two models layer by layer to check whether there is an abnormal quantization op such as the data range is too large or the scale is unreasonable, e.g., certain ops with physical meanings should be set to a fixed scale.
The overall flow chart is as follows:
A whole example is as follows:
from horizon_plugin_profiler import QuantAnalysis

import torch
from torch import nn
from torch.quantization import DeQuantStub, QuantStub

from horizon_plugin_pytorch import set_march, qint8
from horizon_plugin_pytorch.quantization import FakeQuantState
from horizon_plugin_pytorch.quantization import hbdk4 as hb4
from horizon_plugin_pytorch.quantization import (
    prepare,
    set_fake_quantize,
    get_qconfig,
)
from horizon_plugin_pytorch.quantization.qconfig_setter import *


class Net(nn.Module):
    def __init__(self):
        super(Net, self).__init__()
        self.conv = nn.Conv2d(3, 3, 1)
        self.relu = nn.ReLU()
        self.quant = QuantStub()
        self.dequant = DeQuantStub()

    def forward(self, x):
        x = self.quant(x)
        x = self.conv(x)
        x = self.relu(x)
        x = torch.nn.functional.interpolate(
            x, scale_factor=1.3, mode="bilinear", align_corners=False
        )
        x = self.dequant(x)
        return x


data = torch.rand((1, 3, 32, 32))
float_net = Net()
float_net(data)

set_march("nash-e")


############################### Model Structure Checking ##############################
# verify that the prompted exception layer is as expected
calib_net = prepare(
    float_net,
    data,
    qconfig_setter=QconfigSetter(
        get_qconfig(),
        [
            ModuleNameTemplate({"": qint8}),
            ConvDtypeTemplate(),
            MatmulDtypeTemplate(),
        ],
    ),
)
##########################################################################

# do calibration
set_fake_quantize(calib_net.eval(), FakeQuantState.CALIBRATION)
calib_net(data)

float_net.eval()
# Important!!! Set the calibration model into validation state
set_fake_quantize(calib_net.eval(), FakeQuantState.VALIDATION)

# export hbir model
qat_hbir = hb4.export(calib_net, (data,))

############################### quant analysis ############################

# 1. initialization
qa = QuantAnalysis(
    baseline_model=float_net,
    analysis_model=calib_net,
    analysis_model_type="fake_quant",
    device_ids=0,  # GPU index. Analysis will run on cpu if `device_ids` not set.
    out_dir="./floatvsqat",
)

# compare qat and qat hbir is also supported
# qa = QuantAnalysis(
#     baseline_model=calib_net,
#     analysis_model=qat_hbir,
#     analysis_model_type="export",
#     device_ids=0,  # GPU index. Analysis will run on cpu if `device_ids` not set.
#     out_dir="./qatvshbir",
# )

# 2. If there is a known badcase, the badcase input can be set directly through this interface.
qa.set_bad_case(data)

# in practice, it is recommended to use auto_find_bad_case to search for bad cases across the dataloader
# setting the num_steps parameter to control the search range is also supported
# qa.auto_find_bad_case(your_dataloader, num_steps=100)

# 3. run two model
qa.run()

# 4. compare the two model layer-by-layer. Verify that the abnormal layer indicated by abnormal_layer_advisor.txt is as expected
qa.compare_per_layer()

# 5. calculate sensitivity nodes. You can set the topk sorted sensitivity nodes to high accuracy to try to improve the quantization model accuracy
qa.sensitivity()
Analyzing Statistical Information
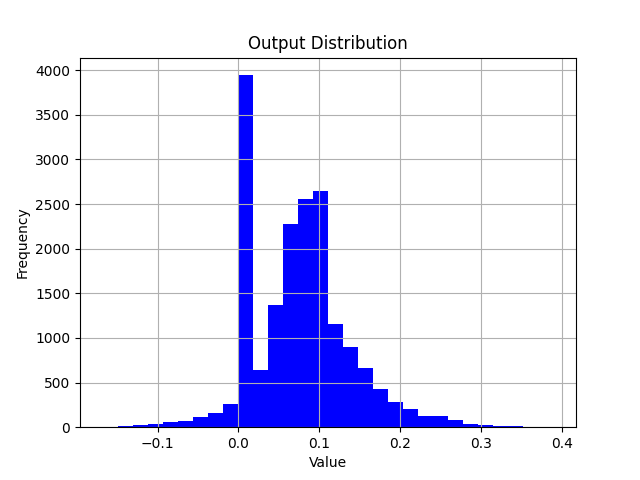
After the run() interface of QuantAnalysis is called, both of baseline_model and analysis_model will perform inference on the badcase, and the input / output of all layers will be saved in the op_infos folder of output path.
import torch
import matplotlib.pyplot as plt

# Load opinfo
opinfo = torch.load("xxx.opinfo")

input = opinfo.input
output = opinfo.output

# Plot value distribution
plt.hist(output[0].as_subclass(torch.Tensor).flatten().cpu().numpy(), bins=30, color='blue')
plt.title("Output Distribution")
plt.xlabel("Value")
plt.ylabel("Frequency")
plt.grid(True)
plt.savefig("output.png")
By loading the opinfo file using torch.load, you can access the input and output of an operator. Then, with matplotlib, you can visualize the corresponding value distribution.
When analyzing the error of a single operator, you can build a model which only contains one operator. Feed the inputs from opinfo into the model and compare the difference between the model output and the opinfo output by visualizing with scatter plots or histograms.
Multi-machine Multi-GPU
QuantAnalysis tool now supports multiple machines and multiple GPUs. If you already have a training environment built with torch.nn.parallel.DistributedDataParallel, you can simply replace the train function with the quant_analysis function in the example.
import os
import sys
import time
import torch
import torch.distributed as dist
import torch.nn as nn
import torch.optim as optim
import torch.multiprocessing as mp
from torch.nn.parallel import DistributedDataParallel as DDP
from torch.utils.data import Dataset, DataLoader
from torch.utils.data.distributed import DistributedSampler

from horizon_plugin_pytorch.quantization import (
    QuantStub,
    prepare,
    QconfigSetter,
    set_fake_quantize,
    FakeQuantState,
    get_qconfig,
    observer_v2,
)
from horizon_plugin_pytorch.quantization.qconfig_setter import ModuleNameTemplate
from horizon_plugin_pytorch.march import set_march
from horizon_plugin_pytorch.dtype import qint8
from torch.ao.quantization import DeQuantStub
from horizon_plugin_profiler import QuantAnalysis
from horizon_plugin_profiler.utils.entities import Metric

# Example dataset. Please use the evaluation dataset when debugging
class ExampleDataset(Dataset):
    def __init__(self, size=10000, input_size=32):
        self.size = size
        self.data = torch.randn(size, 3, input_size, input_size)

    def __len__(self):
        return self.size

    def __getitem__(self, idx):
        return self.data[idx]


# Model definition
class ConvNet(nn.Module):
    def __init__(self, num_classes=10):
        super(ConvNet, self).__init__()
        self.layer1 = nn.Sequential(
            nn.Conv2d(3, 16, kernel_size=3, stride=1, padding=1),
            nn.BatchNorm2d(16),
            nn.ReLU(),
            nn.MaxPool2d(kernel_size=2, stride=2),
        )
        self.layer2 = nn.Sequential(
            nn.Conv2d(16, 32, kernel_size=3, stride=1, padding=1),
            nn.BatchNorm2d(32),
            nn.ReLU(),
            nn.MaxPool2d(kernel_size=2, stride=2),
        )
        self.fc = nn.Linear(8 * 8 * 32, num_classes)
        self.quant = QuantStub()
        self.dequant = DeQuantStub()

    def forward(self, x):
        x = self.quant(x)
        x = self.layer1(x)
        x = self.layer2(x)
        x = x.reshape(x.size(0), -1)
        x = self.fc(x)
        x = self.dequant(x)
        return x


def setup(rank, world_size, master_addr, master_port):
    """Initialize the distributed environment"""
    os.environ["MASTER_ADDR"] = master_addr
    os.environ["MASTER_PORT"] = str(master_port)

    # Initialize process group
    dist.init_process_group(backend="nccl", rank=rank, world_size=world_size)
    torch.cuda.set_device(rank)  # set current GPU


def cleanup():
    """Cleaning up the distributed training environment"""
    dist.destroy_process_group()


def quant_analysis(rank, world_size, config):
    setup(rank, world_size, config["master_addr"], config["master_port"])

    # Set the target hardware platform code, pay attention to the march distinction here nash-e/m/p
    set_march("nash-e")
    float_net = ConvNet()

    # prepare, must use DistributedSampler
    dataset = ExampleDataset(size=10000)
    sampler = DistributedSampler(
        dataset,
        num_replicas=world_size,
        rank=rank,
        shuffle=False,
    )
    dataloader = DataLoader(
        dataset,
        batch_size=1,  # It is recommended to set batch = 1 when debugging
        sampler=sampler,
        num_workers=config["num_workers"],
        pin_memory=True,
    )

    # Load the trained float model checkpoint. Note that the parameter here needs to be replaced with your actual model checkpoint path.
    float_ckpt = torch.load("/your_float_ckpt_path")
    float_net.load_state_dict(float_ckpt)

    # Convert floating point model to calib model
    example_inputs = torch.rand((1, 3, 32, 32))
    calib_net = prepare(
        float_net,
        example_inputs,
        QconfigSetter(
            reference_qconfig=get_qconfig(observer=observer_v2.MSEObserver),
            templates=[
                ModuleNameTemplate({"": qint8}),
            ],
        ),
    )

    # Load the calibration checkpoint. Note that the parameter here needs to be replaced with your actual model checkpoint path.
    calib_ckpt = torch.load("/your_calib_ckpt_path")
    calib_net.load_state_dict(calib_ckpt)

    # Important!!! Set the calibration model into validation state
    float_net.eval()
    set_fake_quantize(calib_net.eval(), FakeQuantState.VALIDATION)

    # debug
    qa = QuantAnalysis(
        baseline_model=float_net,
        analysis_model=calib_net,
        analysis_model_type="fake_quant",
        device_ids=rank,  # Set device_ids to the current rank
        out_dir=config["output_dir"],
    )
    qa.auto_find_bad_case(
        data_generator=dataloader,
        num_steps=100,
        metric=Metric.ATOL,
    )
    qa.run()
    qa.compare_per_layer()
    qa.sensitivity(metric=Metric.ATOL)

    # Cleaning up the distributed training environment
    cleanup()


def main():
    import argparse

    parser = argparse.ArgumentParser(description="Multi-Node QuantAnalysis")
    parser.add_argument(
        "--nnodes", type=int, default=1, help="number of nodes in the cluster"
    )
    parser.add_argument(
        "--nproc_per_node",
        type=int,
        default=torch.cuda.device_count(),
        help="number of GPUs per node",
    )
    parser.add_argument(
        "--node_rank",
        type=int,
        default=0,
        help="rank of this node in the cluster (0-indexed)",
    )
    parser.add_argument(
        "--master_addr",
        type=str,
        default="localhost",
        help="IP address of the master node (node with rank 0)",
    )
    parser.add_argument(
        "--master_port",
        type=int,
        default=29500,
        help="port on master node for communication",
    )
    parser.add_argument(
        "--num_workers",
        type=int,
        default=4,
        help="number of data loader workers per GPU",
    )
    parser.add_argument(
        "--output_dir",
        type=str,
        default="./quant_analysis_output",
        help="directory to save debug outputs",
    )

    args = parser.parse_args()

    os.makedirs(args.output_dir, exist_ok=True)

    config = {
        "master_addr": args.master_addr,
        "master_port": args.master_port,
        "num_workers": args.num_workers,
        "output_dir": args.output_dir,
    }

    # Calculating the global world size
    world_size = args.nnodes * args.nproc_per_node

    # Print configuration information
    if args.node_rank == 0:
        print(f"Starting multi-node QuantAnalysis with:")
        print(f"  Nodes: {args.nnodes}")
        print(f"  GPUs per node: {args.nproc_per_node}")
        print(f"  Total GPUs: {world_size}")
        print(f"  Master address: {args.master_addr}:{args.master_port}")

    # Start distributed debugging
    mp.spawn(
        quant_analysis, args=(world_size, config), nprocs=args.nproc_per_node, join=True
    )


if __name__ == "__main__":
    main()
API Reference
Model Structure Checking
# from horizon_plugin_pytorch.utils.check_model import check_qat_model

def check_qat_model(
    model: torch.nn.Module,
    example_inputs: Any,
    save_results: bool = False,
    out_dir: Optional[str] = None,
):
Check if there are structures in the calibration/qat model that are not favorable for quantization and if the quantization qconfig configuration is as expected.
Parameters
-
model: model to be checked.
-
example_inputs: model inputs.
-
save_results: whether to save the check results to a txt file. Default is False.
-
out_dir: save path of the result file 'model_check_result.txt'. Default is empty, save to .model_check_results/.
Output
-
screen output: abnormal layers that check out.
-
model_check_result.txt: generated when save_results = True. It consists of 5 main parts:
1). Unfused pattern.
2). The calling times of each module. Normally each op is called only 1 time, 0 means it is not called, more than 1 time means it is shared many times. If it is not called or shared multiple times, an exception prompt will be displayed.
3). The qconfig configuration for each op output.
4). The qconfig configuration for each op weight (if any).
5). Exception qconfig hints (if any).
Fusable modules are listed below:
name    type
------  -----------------------------------------------------
conv    <class 'horizon_plugin_pytorch.nn.qat.conv2d.Conv2d'>
relu    <class 'horizon_plugin_pytorch.nn.qat.relu.ReLU'>

All modules in the model run exactly once.

Each layer out qconfig:
+---------------+-----------------------------------------------------------+---------------+---------------+----------------+-----------------------------+
| Module Name   | Module Type                                               | Input dtype   | out dtype     | ch_axis        | observer                    |
|---------------+-----------------------------------------------------------+---------------+---------------+----------------+-----------------------------|
| quant         | <class 'horizon_plugin_pytorch.nn.qat.stubs.QuantStub'>   | torch.float32 | qint8         | -1             | MovingAverageMinMaxObserver |
| conv          | <class 'horizon_plugin_pytorch.nn.qat.conv2d.Conv2d'>     | qint8         | qint8         | -1             | MovingAverageMinMaxObserver |
| relu          | <class 'horizon_plugin_pytorch.nn.qat.relu.ReLU'>         | qint8         | qint8         | qconfig = None |                             |
| dequant       | <class 'horizon_plugin_pytorch.nn.qat.stubs.DeQuantStub'> | qint8         | torch.float32 | qconfig = None |                             |
+---------------+-----------------------------------------------------------+---------------+---------------+----------------+-----------------------------+

Weight qconfig:
+---------------+-------------------------------------------------------+----------------+-----------+---------------------------------------+
| Module Name   | Module Type                                           | weight dtype   |   ch_axis | observer                              |
|---------------+-------------------------------------------------------+----------------+-----------+---------------------------------------|
| conv          | <class 'horizon_plugin_pytorch.nn.qat.conv2d.Conv2d'> | qint8          |         0 | MovingAveragePerChannelMinMaxObserver |
+---------------+-------------------------------------------------------+----------------+-----------+---------------------------------------+
Note
The prepareinterface has integrated this check. Please pay attention to the inspection results output by this interface and make targeted adjustments to the model based on the inspection results.
QuantAnalysis Class
QuantAnalysis class can automatically find the bad case with the largest output of two models, and use it as input to compare the output of two models layer by layer.
In addition, QuantAnalysis class also provides the function of calculating the sensitivity, you can try to set the node with the topk sensitivity ranking with high accuracy, such as int16 quantization, to improve the accuracy of quanitized model.
class QuantAnalysis(object):
    def __init__(
        self,
        baseline_model: Union[torch.nn.Module, HbirModule],
        analysis_model: Union[torch.nn.Module, HbirModule],
        analysis_model_type: str,
        device_ids: Union[List[int], int] = None,
        post_process: Optional[Callable] = None,
        out_dir: Optional[str] = None,
    )
Parameters
-
baseline_model: baseline model (high accuracy).
-
analysis_model: model to be analyzed ( accuracy dropping points).
-
analysis_model_type: model to be analyzed. Support input:
-
fake_quant: the model to be analyzed can be a calibration model with dropped accuracy, in which case the baseline model can be either the original floating-point model or a accuracy-compliant calibration model in a mixed int8/int16 configuration.
-
pre_export: the model to be analyzed is a pseudo-quantized model with lookup table (LUT) for fixed-point conversion, and the benchmark model is the corresponding original pseudo-quantized model.
-
export: the model to be analyzed is a pseudo-quantized HBIR model, and the benchmark model is the corresponding pseudo-quantized model with LUT for fixed-point conversion.
-
convert: the model to be analyzed is a fixed-point HBIR model, and the benchmark model is the corresponding pseudo-quantized model with LUT for fixed-point conversion.
-
device_ids: GPU device ids to run analysis. Default None.
-
post_process: post process function which performs on model output.
-
out_dir: specify the output directory for the comparison results.
Attention
Because QAT training changes the model weight distribution, we generally do not recommend comparing floating point or calibration models with qat models.
The methods in this class are as follows.
auto_find_bad_case
def auto_find_bad_case(
    self,
    data_generator: Iterable,
    num_steps: int = sys.maxsize,
    metric: Union[str, _Metric] = Metric.ATOL,
    device: Optional[Union[torch.device, str, int, List[int]]] = None,
    custom_metric_func: Optional[Callable] = None,
    custom_metric_order_seq: Optional[str] = None,
    cached_attrs: Optional[Tuple[str, ...]] = None,
    dump_in_run: bool = False,
):
Automatically find the badcase that causes the worst output for the two models.
Parameters
-
data_generator: dataloader or a custom iterator that produces one piece of data per iteration.
-
num_steps: number of iteration steps.
-
metric: specify which metric to use as the metric for the badcase. default is to use the worst result of ATOL. Support COSINE/L1/ATOL.
-
device: deprecated. Specify the GPU through device_ids during initialization of QuantAnalysis.
-
custom_metric_func: deprecated. Custom metrics are no longer supported.
-
custom_metric_order_seq: deprecated. Custom metrics are no longer supported.
-
cached_attrs: cached attrs to use as input. Usually used in sequence model. For instance, some results of the first frame must be treated as input when running the second frame, Default None.
-
dump_in_run: whether dump badcase during the running process.
Note
Function auto_find_bad_casegoes through data_generator, runs baseline model and analysis model, computes each output results on COSINE/L1/ATOL metrics and finds the baddest input case on each metric.
Output
set_bad_case
def set_bad_case(
    self,
    data: Any,
    baseline_model_cached_attr: Optional[Dict] = None,
    analysis_model_cached_attr: Optional[Dict] = None,
):
Set the badcase manually.
Attention
Usually, we suggest that you find badcase by function auto_find_bad_case. If the manual set badcase is not the actual badcase, it is difficult for quant analysis tool to find quantization sensitive layers.
Parameters
load_bad_case
def load_bad_case(self, filename: Optional[str] = None)
Load badcase from the specified file.
Parameters
- filename: specified file path. Defaultly, it loads all badcase related files saved by function
auto_find_bad_case from directory specified by out_dir.
save_bad_case
Save badcase to the {self.out_dir}/badcase.pt file.
Attention
It is used with set_bad_case. Usually, you do not need to invoke this function.
set_model_profiler_dir
def set_model_profiler_dir(
    self,
    baseline_model_profiler_path: str,
    analysis_model_profiler_path: str,
):
Specify the path to save the output of model_profiler manually.
In some cases, the ModelProfiler is defined and run before QuantAnalysis is initialized, in which case you can directly specify the path to the existing ModelProfiler,
skipping the run step of QuantAnalysis and comparing the output of the two models directly.
Parameters
run
def run(
    self,
    device: Optional[Union[torch.device, str, int]] = None,
    index: Optional[int] = None,
)
Run the two models and save the results for each layer in the model separately.
Parameters
Attention
Only index found by auto_find_bad_case and shown in badcase.txtis allowed to be parameter.
compare_per_layer
def compare_per_layer(
    self,
    prefixes: Tuple[str, ...] = None,
    types: Tuple[Type, ...] = None,
):
Compare the results of each layer in the two models.
Parameters
Note
Usually you do not need to specify the prefixes and typesparameters. If you want to skip the comparison of certain ops with less quantitative impact based on some prior experience, or want to save time, you can use these two parameters to specify the comparison of certain ops or a certain type of ops.
Output
-
abnormal_layer_advisor.txt: all anomaly layers, including cases of data range too large/outputs with inf or NaN/outputs without high accuracy.
-
compare_per_layer_out.txt: show the specific information of each layer in the model in the form of a table, including various metrics, data ranges, quantized dtype, etc.. Each column from left to right represents:
-
Index: op index.
-
mod_name: name of the op, if the op is of module type, the prefix name of the module in the model will be shown, if it is of function type, it will not be shown.
-
base_op_type: type of the op in the base model, may be module type or function name.
-
analy_op_type: type of the op in the model to be analyzed, could be module type or function name.
-
Shape: shape of the op.
-
quant_dtype: quantized type output of the op.
-
Qscale: quantized scale output of the op.
-
Cosine: cosine similarity of the op output in the two models.
-
L1: L1 distance of the op output in the two models.
-
Atol: absolute error of the op output in the two models.
-
max_qscale_diff: the max N scale diff of the op output in the two models.
-
base_model_min: minimum value of the op output in the baseline model.
-
analy_model_min: minimum value of the op output in the model to be analyzed.
-
base_model_max: maximum value of the op output in the baseline model.
-
analy_model_max: maximum value of the op output in the model to be analyzed.
-
base_model_mean: average of the op output in the baseline model.
-
analy_model_mean: average of the op output in the model to be analyzed.
+----+------------+--------------------------------------------------------------------+--------------------------------------------------------------------+----------------------------+---------------+-----------+-----------+-----------+-----------+-------------------+------------------+-------------------+------------------+-------------------+-------------------+--------------------+
|    | mod_name   | base_op_type                                                       | analy_op_type                                                      | shape                      | quant_dtype   |    qscale |    Cosine |        L1 |      Atol |   max_qscale_diff |   base_model_min |   analy_model_min |   base_model_max |   analy_model_max |   base_model_mean |   analy_model_mean |
|----+------------+--------------------------------------------------------------------+--------------------------------------------------------------------+----------------------------+---------------+-----------+-----------+-----------+-----------+-------------------+------------------+-------------------+------------------+-------------------+-------------------+--------------------|
|  0 | quant      | torch.ao.quantization.stubs.QuantStub                              | horizon_plugin_pytorch.nn.qat.stubs.QuantStub                      | torch.Size([1, 3, 32, 32]) | qint8         | 0.0078404 | 0.9999922 | 0.0019772 | 0.0039202 |         0.5000016 |        0.0002798 |         0.0000000 |        0.9996471 |         0.9957269 |         0.4986397 |          0.4986700 |
|  1 | conv       | torch.nn.modules.conv.Conv2d                                       | horizon_plugin_pytorch.nn.qat.conv2d.Conv2d                        | torch.Size([1, 3, 32, 32]) | qint8         | 0.0056401 | 0.9999791 | 0.0020876 | 0.0092935 |         1.6477517 |       -0.7193903 |        -0.7162931 |        0.5436335 |         0.5414499 |        -0.0423445 |         -0.0413149 |
|  2 | relu       | torch.nn.modules.activation.ReLU                                   | torch.nn.modules.activation.ReLU                                   | torch.Size([1, 3, 32, 32]) | qint8         | 0.0056401 | 0.9999741 | 0.0009586 | 0.0088447 |         1.5681799 |        0.0000000 |         0.0000000 |        0.5436335 |         0.5414499 |         0.1555644 |          0.1557564 |
|  3 |            | horizon_plugin_pytorch.nn.interpolate.autocasted_interpolate_outer | horizon_plugin_pytorch.nn.interpolate.autocasted_interpolate_outer | torch.Size([1, 3, 41, 41]) | qint8         | 0.0056401 | 0.9924216 | 0.0160291 | 0.2094204 |        37.1305954 |        0.0000000 |         0.0000000 |        0.5149657 |         0.5301697 |         0.1550578 |          0.1559310 |
|  4 | dequant    | torch.ao.quantization.stubs.DeQuantStub                            | horizon_plugin_pytorch.nn.qat.stubs.DeQuantStub                    | torch.Size([1, 3, 41, 41]) | torch.float32 |           | 0.9924216 | 0.0160291 | 0.2094204 |                   |        0.0000000 |         0.0000000 |        0.5149657 |         0.5301697 |         0.1550578 |          0.1559310 |
+----+------------+--------------------------------------------------------------------+--------------------------------------------------------------------+----------------------------+---------------+-----------+-----------+-----------+-----------+-------------------+------------------+-------------------+------------------+-------------------+-------------------+--------------------+
-
compare_per_layer_out.csv: show the specific information of each layer in csv format. The content is exactly the same as compare_per_layer_out.txt, and the csv file format is convenient for you to open and analyze by excel and other software.
sensitivity
def sensitivity(
    self,
    device: Optional[torch.device] = None,
    metric: Union[str, _Metric] = Metric.ATOL,
    reserve: bool = False
):
Sensitivity ordering of individual nodes in the model. Applies to the float conversion to calibration accuracy dropout problem.
Parameters
-
device: deprecated. Specify the GPU through device_ids during initialization of QuantAnalysis.
-
metric: metric for similarity ordering, default is ATOL, support COSINE/L1/ATOL.
-
reserve: whether to print sensitivity nodes in reverse order to support returning some int16 operators to int8 to improve on-board performance.
Output
-
sensitive_ops.txt. The file is organized in order of quantization sensitivity from highest to lowest op. Each column from left to right represents:
-
op_name: op name.
-
sensitive_type: Type of calculating quantization sensitivities, including:
-
activation: quantization sensitivity to quantize only the output of this op.
-
weight: quantization sensitivity of the weight of the op only.
-
input-{n}:quantization sensitivity of the nst input of the op only。
-
op_type: op type.
-
metric: the metric for calculating sensitivity. Sort the metrics in descending order of sensitivity. Support following metrics. L1 is used by default.
-
L1: value range [0, +∞], the higher the value, the more sensitive the op is to quantization (in descending order).
-
Cosine: value range [0,1], the closer to 0, the more sensitive the op is to quantization (in descending order).
-
ATOL: value range [0, +∞], the higher the value, the more sensitive the op is to quantization (in descending order).
-
quant_dtype: the quant dtype of this op output. Usually qint8/qint16.
-
flops: the flops of this op and its proportion in the whole model.
-
sensitive_ops.pt: a sensitivity-ordered list saved using torch.save for your subsequent loading use. The format of the list is described in the Return Values section.
Return Value
Sensitivity List, each element in the List is a sub-list recording an op's sensitivity information. each item in the sub-list from left to right is [op_name, sensitive_type, op_type, metric, quant_dtype, flops] .
An example of the whole List is as follows.
[
    [op1, "activation", op1_type, L1, qint8, flops1],
    [op2, "activation", op2_type, L1, qint8, flops2],
    [op3, "activation", op3_type, L1, qint8, flops3],
    [op1, "weight", op1_type, L1, qint8, flops4],
    ...
]
You can configure the ops with the top n quantization sensitivities with high accuracy (e.g., int16) to try to improve the quantized model accuracy.
op_name    sensitive_type    op_type                                                           L1  quant_dtype    flops
---------  ----------------  -------------------------------------------------------  -----------  -------------  -------------
conv       weight            <class 'horizon_plugin_pytorch.nn.qat.conv2d.Conv2d'>    0.000553844  qint8          9216(100.00%)
conv       activation        <class 'horizon_plugin_pytorch.nn.qat.conv2d.Conv2d'>    0.000472854  qint8          9216(100.00%)
quant      activation        <class 'horizon_plugin_pytorch.nn.qat.stubs.QuantStub'>  0.000249175  qint8          0(0%)
clean
Clears intermediate results. Only files such as comparison results are retained.
ModelProfiler Class
Statistic about the inputs and outputs of each layer of operators in the forward process of the model.
# from horizon_plugin_profiler import ModelProfiler

class ModelProfiler(object):
    def __init__(
        self,
        model: torch.nn.Module,
        out_dir: str,
    )
Parameters
Note
This class only supports use by means of a with statement.
with ModelProfiler(net, "./profiler_dir") as p:
    net(data)

p.get_info_manager().table()
p.get_info_manager().tensorboard()
The methods in this class are as follows.
get_info_manager
def get_info_manager(self)
Get the structure that manages the information for each op.
Return Value
The structure OpRunningInfoManager manages the information stored for each op. Two of the important interfaces are as follows.
table
class OpRunningInfoManager:
    def table(
        self,
        out_dir: str = None,
        prefixes: Tuple[str, ...] = None,
        types: Tuple[Type, ...] = None,
        with_stack: bool = False,
    )
Show individual model statistics in a table. Store to the statistic.txt file.
Parameters
-
out_dir: storage path of statistic.txt file, default None, store to self.out_dir.
-
prefixes: prefixes of ops in the model to be counted. Default is all ops.
-
types: types of the ops in the model to be counted, defaults to all ops.
-
with_stack: if or not show the position of each op in the code.
Output
statistic.txt file, each column from left to right reads.
-
Index: op index.
-
Op Name: op type, module class name or function name.
-
Mod Name: if it is module class, the prefix name of the module in the model; if it is function type, the prefix name of the module where the function is located.
-
Attr: input/output/weight/bias.
-
Dtype: data type of the tensor.
-
Scale: scale of the tensor.
-
Min: minimum value of the current tensor.
-
Max: maximum value of the current tensor.
-
Mean: average value of the current tensor.
-
Var: variance of the values in the current tensor.
-
Shape: tensor shape.
+---------+--------------------------------------------------------------------+------------+--------+---------------+-----------+------------+-----------+------------+-----------+----------------------------+
| Index   | Op Name                                                            | Mod Name   | Attr   | Dtype         | Scale     | Min        | Max       | Mean       | Var       | Shape                      |
|---------+--------------------------------------------------------------------+------------+--------+---------------+-----------+------------+-----------+------------+-----------+----------------------------|
| 0       | horizon_plugin_pytorch.nn.qat.stubs.QuantStub                      | quant      | input  | torch.float32 |           | 0.0003164  | 0.9990171 | 0.5015678  | 0.0846284 | torch.Size([1, 3, 32, 32]) |
| 0       | horizon_plugin_pytorch.nn.qat.stubs.QuantStub                      | quant      | output | qint8         | 0.0078354 | 0.0000000  | 0.9950994 | 0.5014852  | 0.0846521 | torch.Size([1, 3, 32, 32]) |
| 1       | horizon_plugin_pytorch.nn.qat.conv2d.Conv2d                        | conv       | input  | qint8         | 0.0078354 | 0.0000000  | 0.9950994 | 0.5014852  | 0.0846521 | torch.Size([1, 3, 32, 32]) |
| 1       | horizon_plugin_pytorch.nn.qat.conv2d.Conv2d                        | conv       | weight | torch.float32 |           | -0.5315086 | 0.5750652 | 0.0269936  | 0.1615299 | torch.Size([3, 3, 1, 1])   |
| 1       | horizon_plugin_pytorch.nn.qat.conv2d.Conv2d                        | conv       | bias   | torch.float32 |           | -0.4963555 | 0.4448483 | -0.0851902 | 0.2320642 | torch.Size([3])            |
| 1       | horizon_plugin_pytorch.nn.qat.conv2d.Conv2d                        | conv       | output | qint8         | 0.0060428 | -0.7674332 | 0.4652941 | -0.0412943 | 0.0422743 | torch.Size([1, 3, 32, 32]) |
| 2       | horizon_plugin_pytorch.nn.qat.relu.ReLU                            | relu       | input  | qint8         | 0.0060428 | -0.7674332 | 0.4652941 | -0.0412943 | 0.0422743 | torch.Size([1, 3, 32, 32]) |
| 2       | horizon_plugin_pytorch.nn.qat.relu.ReLU                            | relu       | output | qint8         | 0.0060428 | 0.0000000  | 0.4652941 | 0.0639115  | 0.0089839 | torch.Size([1, 3, 32, 32]) |
| 3       | horizon_plugin_pytorch.nn.interpolate.autocasted_interpolate_outer |            | input  | qint8         | 0.0060428 | 0.0000000  | 0.4652941 | 0.0639115  | 0.0089839 | torch.Size([1, 3, 32, 32]) |
| 3       | horizon_plugin_pytorch.nn.interpolate.autocasted_interpolate_outer |            | output | qint8         | 0.0060428 | 0.0000000  | 0.3504813 | 0.0639483  | 0.0043366 | torch.Size([1, 3, 41, 41]) |
| 4       | horizon_plugin_pytorch.nn.qat.stubs.DeQuantStub                    | dequant    | input  | qint8         | 0.0060428 | 0.0000000  | 0.3504813 | 0.0639483  | 0.0043366 | torch.Size([1, 3, 41, 41]) |
| 4       | horizon_plugin_pytorch.nn.qat.stubs.DeQuantStub                    | dequant    | output | torch.float32 |           | 0.0000000  | 0.3504813 | 0.0639483  | 0.0043366 | torch.Size([1, 3, 41, 41]) |
+---------+--------------------------------------------------------------------+------------+--------+---------------+-----------+------------+-----------+------------+-----------+----------------------------+
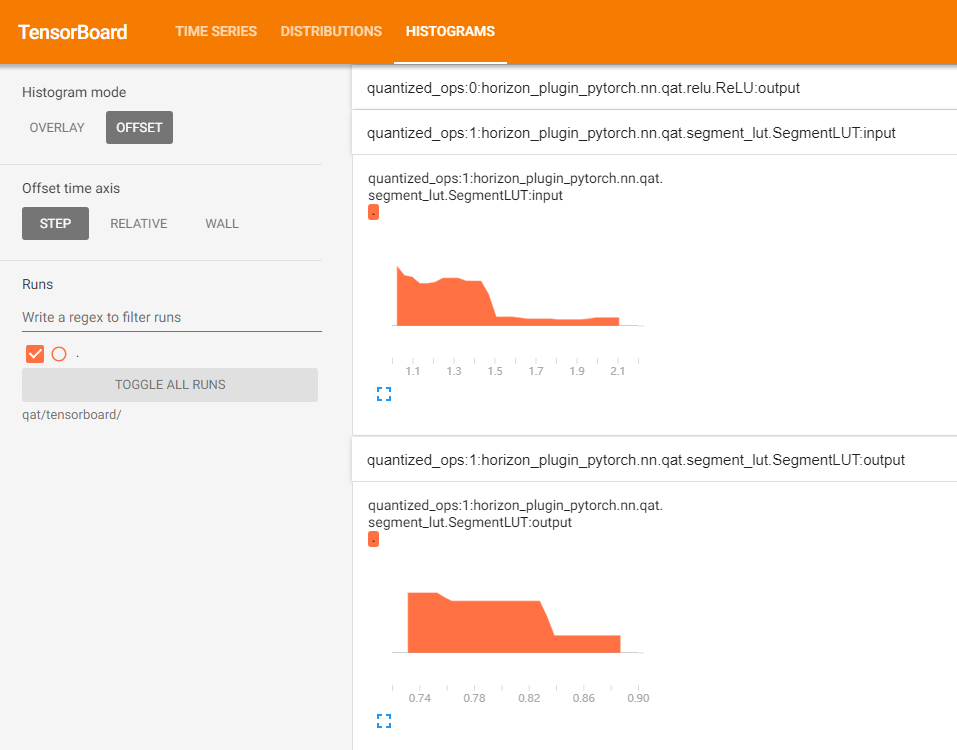
tensorboard
class OpRunningInfoManager:
    def tensorboard(
        self,
        out_dir: str = None,
        prefixes: Tuple[str, ...] = None,
        types: Tuple[Type, ...] = None,
        force_per_channel: bool = False,
    ):
Show the input and output histograms for each layer in the tensorboard.
Parameters
-
out_dir: directory where tensorboard related files are kept. Default is self.out_dir/tensorboard.
-
prefixes: prefixes of the ops in the model to be counted, default is all.
-
types: types of the ops in the model to be counted, default is all.
-
force_per_channel: if or not to display the histogram in per_channel quantization.
Output
The tensorboard file, opened with the following screenshot.
HbirModelProfiler Class
The functionality and usage of this class is identical to the ModelProfiler class. Please refer to ModelProfiler Class for usage.
Attention
Due to the special format of the hbir model, the qat hbir model needs to add index 0 at forward process.
with HbirModelProfiler(qat_hbir, "./hbir_dir") as p:
    qat_hbir[0](data)

p.get_info_manager().table()
p.get_info_manager().tensorboard()